
Dangerous heat stress away from the Hills of Sri Lanka since April
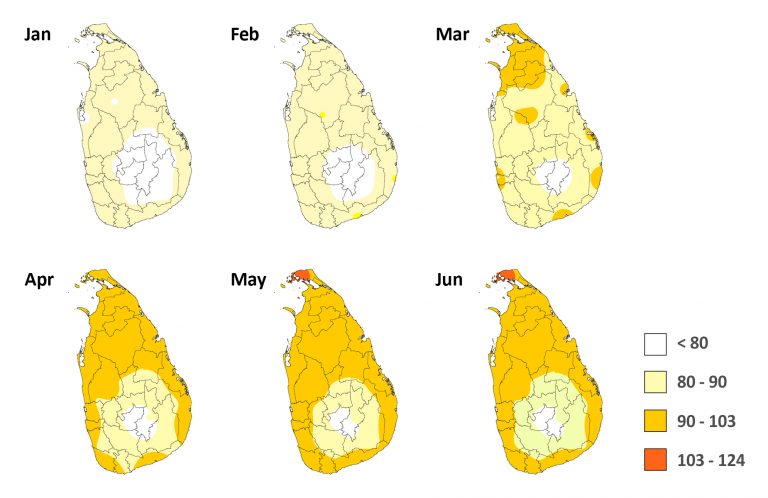
The general public in Sri Lanka has been inconvenienced due to hot weather being experienced in some parts of the country to a noticeable degree in the past six months. Hot weather in Sri Lanka is increasing dangerously in 2019. We have identified the locations to be cautious of the hot weather in Sri Lanka for the first six months of 2019. The Heat Index (HI) has been calculated by using relative humidity and temperature and this is a measure of how hot it really feels on the body when relative humidity is factored with the actual air temperature.

When considering the pattern of HI in the island, Comfort Level can be recognized in the stations situated in Central Highland mainly at Nuwara-Eliya, Diyathalawa and Kandy than sea level and intermediate zones. HI values are varying with the seasonal rainfall and environment lapse rate which are occurring with the nature of the topography and orography.
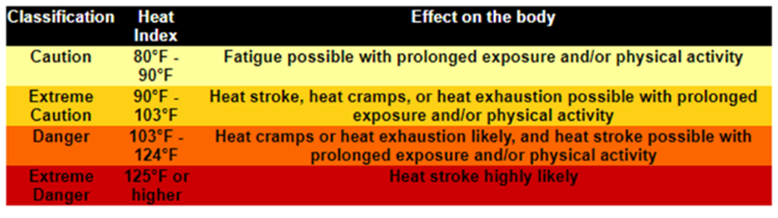
The monthly HI is varying from comfortable level to danger level for the first six months of 2019. In January to March, Caution Level can be identified in some parts of the Northern, North Central provinces and some coastal areas. Higher temperature value from April – June is responsible for increased HI values. In this period, HI values have been gone up to Danger level in some parts in Northern province and Extreme Caution Level can be identified in North Central, Eastern and North-Western provinces and coastal areas.
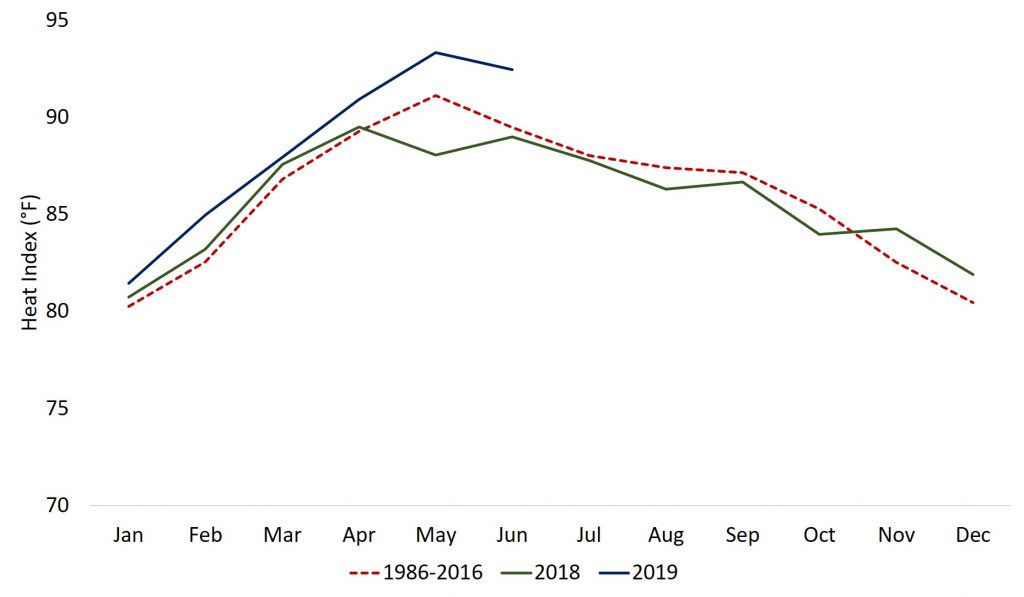
We have obtained a mean annual cycle of HI values to understand the pattern of heat index value events over the year. These annual cycles are characterized by mean of monthly HI values over the period 1986 – 2016. An upward shift in the HI values is noticeable throughout the first 6 months in 2019. According to the HI chart, April to July can be acknowledged within Danger and Extreme Caution Levels while the rest of the year within Comfort and Caution Levels for the period 1986-2016.