Drought Monitoring
Visit our Sri Lanka Drought portal for more details.
Drought is the disaster that affects most Sri Lankans. Drought may be characterized in terms of its rainfall deficits and excess evaporation (meteorological), shortfalls in streamflow and soil moisture (hydrological), impacts on agriculture (agricultural) or impacts on people and ecosystems. We find that relief payments relate strongly to rainfall deficits as measured by drought indices (Lyon et al., 2011).

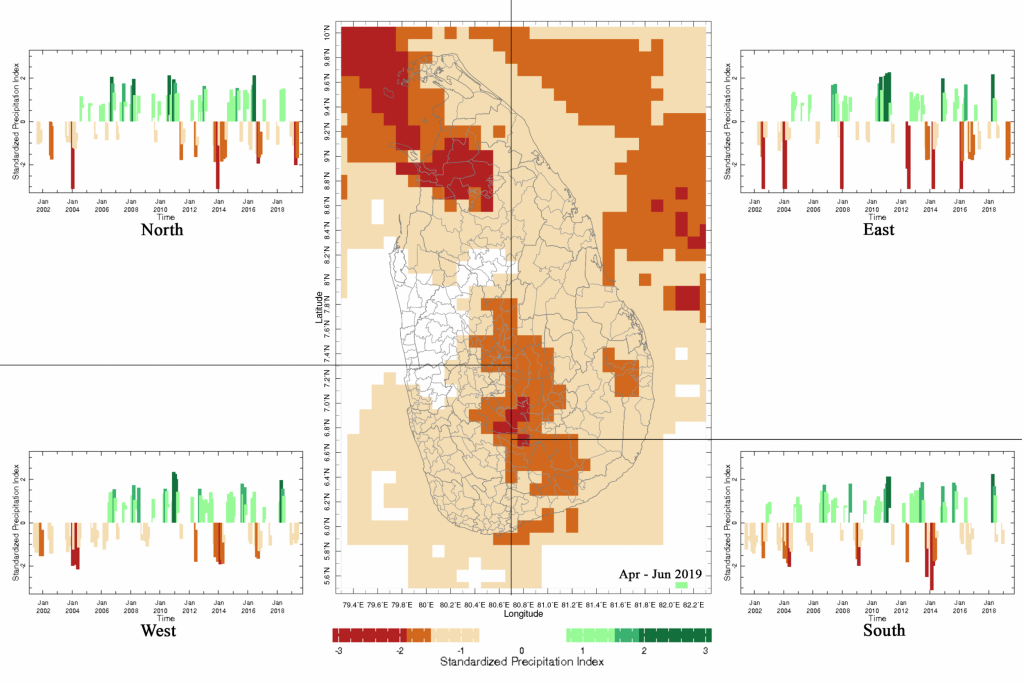
The drought index known as Standardized Precipitation Index (SPI) calculated over the last 3 months is shown for the region around Sri Lanka is mapped below. The Northern Jaffna, Vavuniya and Mannar districts and the Kandy, Nuwara Eliya and the boundary between Ratnapura and Moneragala districts show the strongest drought.
The history of the drought index for the last 19 years is also shown. The intensity of the drought is shown as bars and darker the brown the greater the strength of the drought. During the current period there is a significant drought in Northern and Eastern region. However, the drought is not as severe as in 2004 or 2014
Rainfall Monitoring
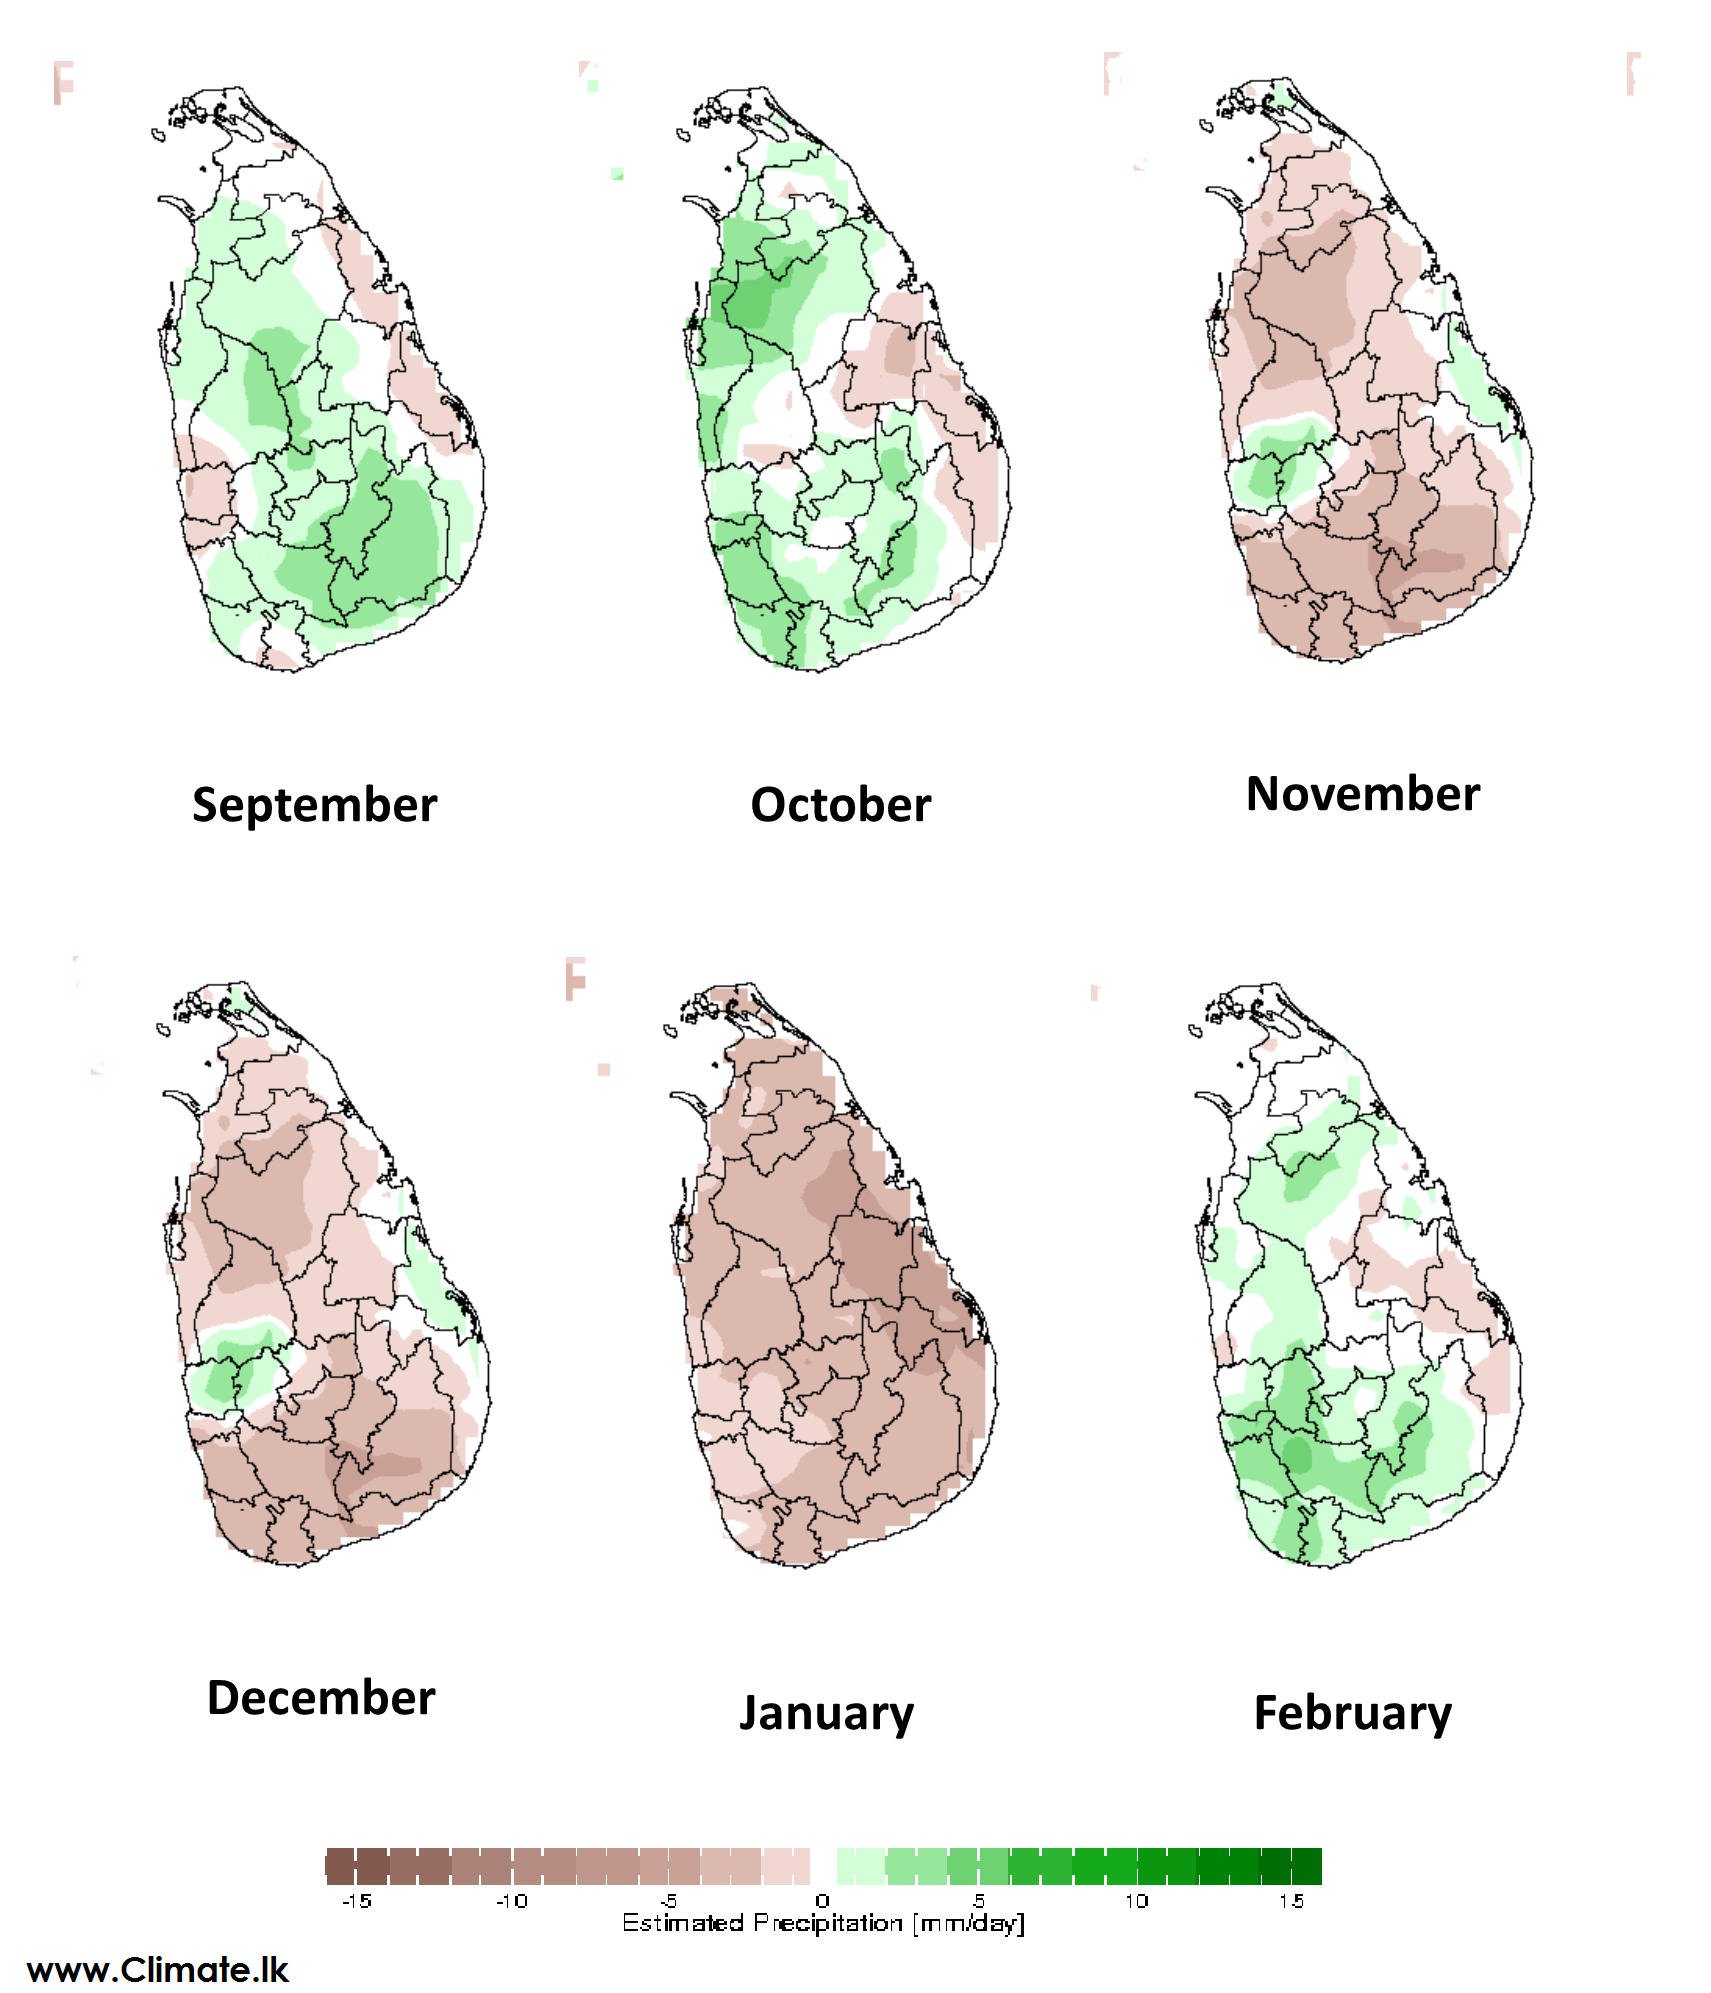
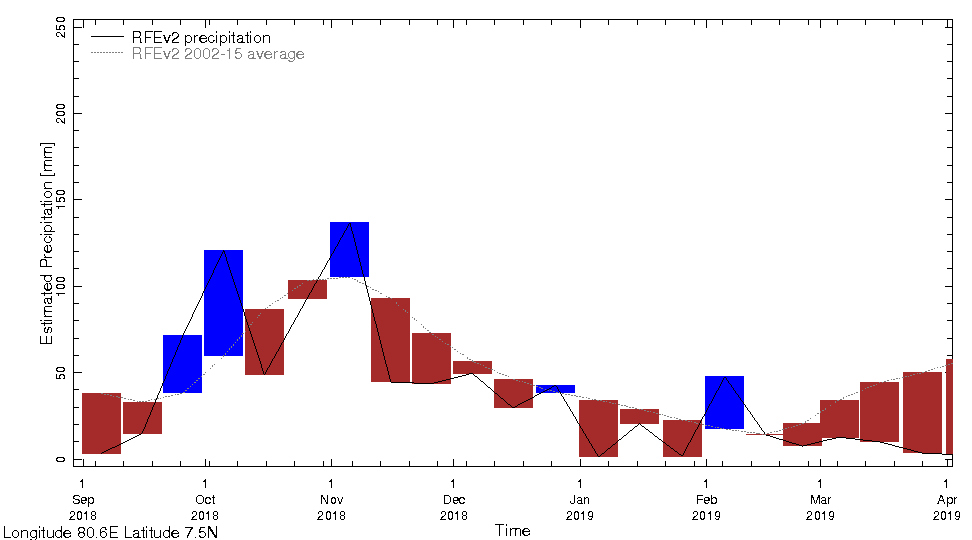
The 3 Panels below shows the variation by dekadal (3 times a month) and the map shows anomalies for the first half of the Maha Season 2018/19 starting from the month of September


